Introduction
This phenology model/degree-day calculator uses weather data to
calculate degree-days, also known as heat units that are used to
estimate development of many organisms, such as insects and plants.
This app is a re-designed, mobile-friendly, member of a family of
online model/calculators at:
USPEST.ORG (home page). The numerous models served by this app
are all driven only by daily maximum and minimum temperatures, using
one of many different degree-day calculation formulas, many of which
are described at this
UC Davis IPM
website. Note that this app
requires an internet
connection and will not work in airplane or off-line mode.
Instructions for Use
We split this app into tabbed sections in 1 or 2 rows near the top of
the page. Use the tabs from left to right. This introduction is in the
first tab, Intro. Notice while using this app, if you see the
 icon, click on it to access more explanatory information via a pop-up
help window.
icon, click on it to access more explanatory information via a pop-up
help window.
The Station Tab
The second tab, Station, is where you select a source of
weather data needed to run the models. This source is usually a
weather station from our database, or it can be a file you upload.
Our station database contains around 29,000 weather stations from
hundreds of weather networks throughout the U.S., with more in Canada
and Mexico and some other surrounding places. Most of our weather
data comes from Mesowest in Utah.
We also have data from participating agricultural weather networks
(scroll to far bottom of this page and read the fine print to see
some of these).
To find a weather station, enter a known weather station code
(e.g. ARAO), a zip code, or a city and state abbreviation. Then click
on the button search for stations to find 1 or more
expandable lists (click on + sign to expand, - to
contract) of the 4-8 nearest stations. Once you click on a station
code, you should see the text Selected station: with a
station code and a place name. When you see this, you have selected
a weather station. Be aware that not all weather stations are
reliable, so you may need to return to this step.
You may also click on the (MAP) link to open a Google map selection
option. With this, you can zoom in, zoom out, pan, and click a
station pin to select a station.
If you want to upload a file, select Upload file (below the
station search box, just above Next). You will need a file
in the required format. Select
the file, enter a label for your reference, select Celsius
or
Fahrenheit as appropriate, and click Upload.
The Model Tab
Once you have a station selected, click on the next tab,
Model. This tab begins with selection of a model
category. For example, all models (ca. 139 models), insects (ca. 76
models), weeds (5 models), plant diseases (6 models), and crops (46
models), plus various combinations based on other criteria, such as
invasive insects (27 models), apple and pear (16 models), stone
fruits and nuts (12 models), etc.
see current list.
Note that all categories include generic degree-day
calculator as the first option; this is described below. Also
note that none of these models are driven by hourly weather, only by
daily max and min temperatures. See
our list of apps at USPEST.ORG
for hourly driven models, including most plant disease infection risk
models.
Model Options
Once you have selected a model, you may need to change the dates.
Dates
The start date is a critical input to any degree-day model. How
the start date is chosen varies between models; a sentence in green
text will give you guidance specific to the model you chose. Some
models start when a biological event (biofix) occurs; these may
require monitoring data. Other models are designed to start on a
fixed date (such as Jan 1 or Mar 1), and you can use this date
without concern.
The end date is not critical, as long as it set after the events of
interest.
Forecast Options
If the end date is in the future, we will use a forecast for future
weather. For the first 5 or 7-day forecasts, we use conventional
forecasts from either from NWS or Fox Weather LLC. After that, we
use weather data from one of several sources up until the end date.
Current 8+ day forecast options include:
- 10 year averages
-
most recent (updated every other month) 10-year average PRISM data
localized to the currently selected weather station
- 30 year averages
-
30-year Normals (currently 1981-2010) from the National Weather Service
- Last year's data
-
data from last year, making the assumption that the rest of this
year will be like last year. (May not be available for new weather
stations)
- Data from 2 years ago
-
data from the year before last (May not be available for new
stations)
- NMME seasonal (7-month) forecast
-
the NOAA North
American Multi-Model Ensemble (NMME) forecast system, which is
an ensemble average of seven different extended (7-month) numerical
models, all driven in part by scientific understanding of how ocean
temperatures and other factors affect seasonal climate and weather
patterns. Check the North American NMME
temperature
and
rainfall
forecast anomaly maps, and the
verification
index to see how well their 1-7 month lead time forecasts have
performed in the past. Use with caution.
- CFSv2 seasonal (currently 3.5-month) forecast
-
the
NOAA NCEP
Coupled Forecast System model version 2 (CFSv2) forecast
system, In contrast to our NMME forecast, this is a single model
from NOAA, and Fox Weather LLC has customized it to attempt to
reproduce realistic rainfall episodes rather than just smoothly
interpolate temperatures and rainfall.
Notes
-
This forecast option will not be available if you run
the model for prior years or you set the end date
earlier than the current date.
-
The forecast option only controls the tables on the "Output"
tab. Multiple forecasts are shown on graphs. See the "Graph
Tab" option below.
Temperature Scale Option
This app will show output in Celsius or Fahrenheit. If you are
using the general-purpose degree-day calculator, this option also
controls the temperature scale used for the lower and upper
thresholds you supply.
DD Calculator Options
If you selected the general-purpose degree-day calculator, then you
have additional options to consider:
Calculation Method
A variety of formulas are used to calculate degree-days. The
most commonly used are "single sine", used for most insect
phenology models and some crop development models, and "simple
average", used for many crop development models. For more
information, including formulas, see
our calculation
methods page or UC
IPM's About Degree-Days page.
Lower threshold
The lower developmental threshold is an approximate
temperature below which development rate has slowed to
zero. This value varies depending on the type of organism and
even the specific species. Usually the lower threshold is
determined using laboratory or field data, and may be
available in the scientific literature.
Upper threshold
The upper threshold is often not known or well studied. It is
recommended that you use whatever guidelines are available for
your organism, if any. Otherwise just leave this at the default
value (currently set at 130°F).
Options not included in this version
To help simplify this version of the calculator for use on mobile
devices, we have removed two features available in an earlier
version, at
uspest.org/dd/model. These
are:
-
Multiple start dates, which may be useful for vegetable phenology
models
-
Daylength (photoperiod) calculations, which can be useful for
species that are photoperiod-responsive such as insects that use
daylength to trigger diapause
Once a model is selected and options chosen, you may scroll down to
review the model information, helping you confirm that you have
selected the appropriate model for your needs. The Model
inputs table includes information such as thresholds, region of
known usage, model events, and links to extension pages and model
source information. Many of the 100+ models were derived from one or
more scientific publications and combined into a working model by OSU
OIPMC in the form of a spreadsheet converted to PDF format.
The Output Tab
Once the Station and Model have been selected, click on
the Output or Graph tabs at
the top of the page to see model predictions or output. The
Output consists of:
Model Inputs table
This like the Model Inputs table, at the bottom of
the Model tab. It is hidden initially, but can be
shown if desired.
Date Comparison table
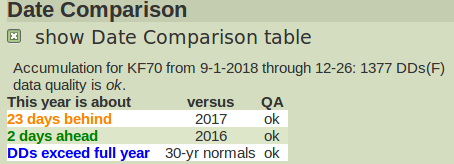
The Date Comparison table shows you how the current year
degree-day accumulation compares to those of recent past years and
the 30-year normals. (Calculations use the current model inputs
including the start date, threshold temperatures, and calculation
method, but different years.)
For example, the table above was created on December 27, 2018, when
1377 DDs had accumulated since September 1st. In 2017, 1377 DDs
had accumulated 23 days earlier (on December 3rd). In 2016,
it took 2 more days (until December 28th) to reach the same total,
and calculation using the 30 year normals did not reach 1377 DDs by
the end of the year. (This example is admittedly somewhat contrived,
but this could apply to e.g. fall-planted vegetables.)
The Date Comparison table is only available when the start date is
in the current year.
Model Output table
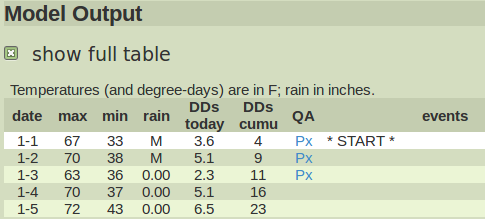
The Model Output table is the main output from this app. It
Each row describes a day, and has the day's date, temperatures
extremes, rainfall, and degree-days. The row also has cumulative
degree-days from the start date to the given day, and it may show data
quality (QA) flags and model events.
The condensed version of the table, which is displayed initially,
only includes days in which a model event occurs. In the full
version of the table, there is a row for every day from the start
date to the end date -- that is, all the days that used in computing
the model.
Data Quality Assurance (QA)
Weather stations failures are common, and they are not always
repaired promptly. Our system estimates values for any missing
data, trying a number of different methods, and using the best one
that succeeds. But estimated data are not as accurate as
measurements, and less accurate model inputs lead to less accurate
outputs. If you are concerned about a station's data quality,
click "show full table" to expand to the full table.
When observations are missing, you will see a QA tag in
the QA field. These tags are short strings indicating
which estimation method was used, and each tag is a links to an
explanation of the method. For example, Px indicates that
the maximum temperature was estimated using PRISM map
interpolation, and Hn indicates that a historical average
minimum temperature was used. (When the QA field is
blank, the temperatures are actual measurements.)
If you see numerous QA tags for dates in the past, you may want to
run the model using a different weather station. (Click on the
Station tab again, click search if necessary, and
use the MAP link to see nearby station locations). If only
a few of these tags appear, then you may expect little error in the
degree-day accumulations. (Use at your own risk).
Observations are also unavailable for dates in the future. In this
case forecasts are used as described above, and tags in
the QA field indicate which forecast is used. For
example, Nm reflects the use of NMME forecast data.
Again, these tags are links to further information.
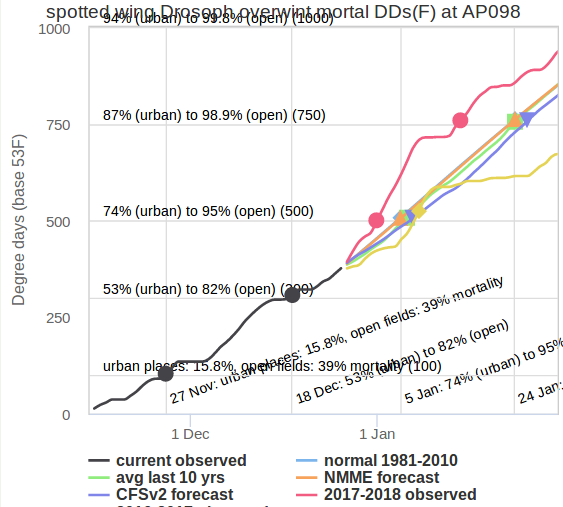
The Graph Tab
This tab presents model output as a graph, with dates on the x-axis
and cumulative degree-days on the y-axis. Predicted model events are
displayed both with reference to the degree-days as horizontal lines
of text, and with reference to dates as diagonal lines of text
starting along the x-axis.
Close-together events may overlap and be difficult to read. To help
overcome this issue, the graph is interactive and allows for zooming
in on the portion of the output you wish to see. Exactly how you
zoom in depends on your device. Values will be shown when you when
you hover over (or lightly touch) a graph line or point. You can
turn off a data line by clicking on it's legend at the bottom of
the graph.
The graph is plotted for the entire interval from start date to end
date, but only the portion containing model events is initially
shown. Clicking reset zoom in the graph will show the
entire graph.
You will usually see several lines on the graph:
-
If the model end date is in the future, a line will be
plotted for each available “forecast”. Each of these
lines will start where the observed data ends, so that you will
see a range of possible futures. These forecasts are discussed
above under Forecast options. For example:
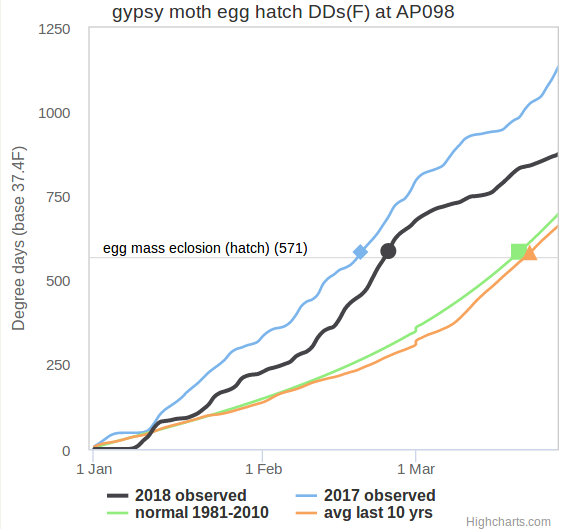
-
If the model end date is in the past, several
“comparison lines” will be displayed as to provide
context for the chosen year. Each of these lines will start at
the start date. These lines may include the years before and
after the chosen year and 10- and 30-year averages. For example:
Email Subscriptions
Automated email delivery of the model outputs displayed in this app
is available at no cost. An email subscription offers model results
for these and other models, for multiple weather stations, on a
schedule that you select. To subscribe, you will need
a uspest.org
account.
Credits
This app was funded primarily by a USDA NIFA CPPM EIP grant to
support IPM at the state and regional level, and by the Oregon State
IPM program at OIPMC. Other sources of support include other NIFA
funded grant programs, including the Western IPM Center, and from
USDA APHIS PPQ support.
Location search using place names (geo-coding) is by OpenCage, using
data © OpenStreetMap contributors. IP address search uses
GeoLite2 data from MaxMind.
Weather Station
Weather data is normally from a station, but you can upload your
own if you prefer.
Next
Select the "Model" tab to choose the
model to use and related details.
All data provided "as is" and users assume all risk in its use -
see full disclaimer. All NWS derived data is not subject to
copyright protection.
This app is produced by uspest.org at the Integrated Plant
Protection Center at Oregon State University with support from the
USDA National Plant Diagnostic Network, The OSU Agricultural
Experiment Station, various USDA CSREES/NIFA grants, USDA SARE, USDA
RMA, and USDA IPM Centers - Western Region. Climate map data provided
by OSU PRISM Group, real-time public weather data provided by U. Utah
Mesowest and other
networks including WSU
AgWeatherNET, AGRIMET, CPS Adcon Networks, IFPNet Automata,
California
CIMIS, California
PestCast, and others. Geo-coding (location search using place
names) by OpenCage, using data © OpenStreetMap contributors.
Previous versions online since May 16, 1997; this is app version
0.95, updated 18 Nov 2022
Contact Len Coop at coopl@science.oregonstate.edu
or 541-737-5523 if you have any questions about this program.