Documentation of Leaf Wetness Calculations:
Many of the plant disease models in this system use leaf wetness (LW) estimates. The following networks generally have leaf wetness sensors (and so are not estimated, but are measured directly):
Oregon Hood River (Adcon and IFPNET)
Oregon Milton Freewater (Adcon)
Oregon Medford (Adcon)
Oregon Willamette Valley (Adcon and Campbell)
Oregon The Dalles (IFPNET)
For weather networks not having their own
LW sensors, we estimate it using a Fox Weather modified version of the Kim et al. (2004) Fuzzy Logic Leaf Wetness (FLLW) Algorithm. The FLLW model uses energy balance principles to assign probabilities to various combinations of temperature, dewpoint, and wind speed that are likely to produce condensation or dew on leaf surfaces. It is relatively robust, can be used in real time, and has worked well thus far in this system.
In addition, because the FLLW algorithm does not account for rainfall-induced leaf wetness, the Fox Weather LLC/IPPC weather/plant disease modeling system includes a precip-drying algorithm (FoxLW). This presumes an exponential-based drying curve and takes into account windspeed, seasonal adjustment, and day/night time.
Details of the FoxLW addition are:
               - For rainfall at 0.05 in/hr, LW = 10 for that hour
               - at 0.02 in/hr: in summer LW = 5, in winter or at night LW = 10.
               - LW should end < 0.5 hour after rain ends during day,
                        and about 1 hour after rain ends at night, for WS = 5mph.

               - if WS=10mph, then LW ends when rain ends.

               - NO LW for rain < 0.02 inch with WS >= 10mph.

               - LW = 3 if rain > 0.01 or < 0.02 with WS <=5mph

               - WS ranges from 5 to 10mph, LW 3 to 0.
The Kim et al. FLLW and FoxLW models are independent and parallel computations for a Leaf Wetness value: We output the HIGHEST LW of the two (they are NOT ADDED together, we just take the MAXIMUM value).
Changes and updates to this system are in development and expected in forthcoming releases.
03/26/2008
Added two new models to the DD calculator/models program, gypsy moth egg hatch
and gypsy moth larval development.
02/12/2008
Added two new models to the DD calculator/models program, peach twig borer
and walnut husk fly.
02/06/2008
Revised state-level tables of weather data. New features include:
- More stations and networks, over 12,000 stations total
- More Degree-Day calculation features built in; current year (2008) linked to nearest forecast (NWS Zone) data & historical average (30-year) normal data; specify calculation end-date, degree-day graph displayed, auto calculate when you click the radio button, pest, crop and disease models database linked in for NW states (OR, WA, ID, MT, WY, AK, BC, UT, CA).
- Links for most stations to hourly weather data and graphs and selected PLANT DISEASE RISK models, including a generic degree-hour type model
- Oregon, S. Washington, W. Idaho forecasted weather data for Plant Disease risk models generated by FOX Weather/OSU IPPC.
- Report on recent hourly data quality
- Ability to sort the tables by clicking in the column headers, sort by Network or Latitude for example
- Smaller tables for major selected Networks available (saves time from loading 600+ station tables)
- New 30 yr average data for W. US, linked to calculator
05/18/2007
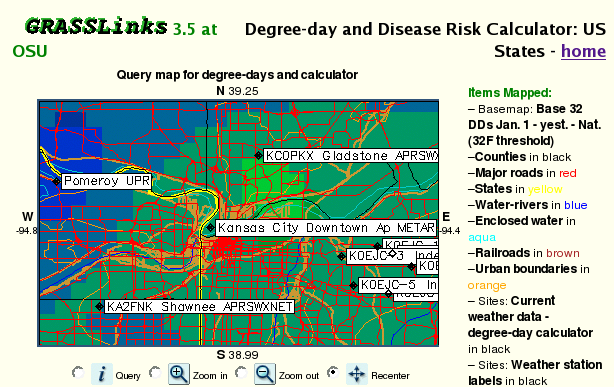
Updating of Grasslinks map interaction interface from version 3.4 to 3.5. Here is an example of the changes.
Grasslinks 3.5 interface zoomed to Kansas City:
Grasslinks 3.4 interface zoomed to Kansas City:
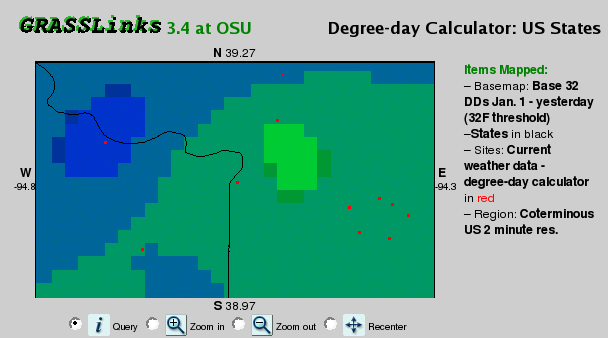
These new features include multiple hierarchical layers, so that only layers appropriate to the zoom level are displayed,
use of a rubber-band style zoom box to allow precise zooming, ability to show site labels, etc.
This gives Grasslinks the essential functionality that more complex programs like Mapserver and Mapbender offer.
All US and regional map pages and the US DD mapping calculator now use the updated interface.
Also, the homepage was slightly redesigned, with a few changes in links here and there.
A recent slide show talk was linked which may provide some instructional value to using this site.
04/04/2007
Now over 10,400 stations total in the system thanks to NPDN funding. Some recently added pest models such as cabbage maggot, a new codling moth model by Alan Knight (USDA-ARS), and apple maggot. New pages for the new Milton-Freewater network, a page with daily DD totals automatically updated for NW Rubus (caneberries), new tables to stations and data for each state, e. g. S. Dakota.
03/03/2006
Historical station data extended to entire US and territories, 3,838 new records making a station total of 5,876. These are from the NCDC Clim84 free online data. Custom and daily DD maps are now using these data, and now you may calculate DDs for any of these 30-year "normals" stations.
02/02/2006
Weather networks now include 2,400+ APRSWXNET stations, plus SNOTEL expanded from 334 to 672 stations, and with other adjustments, total stations have expanded from 3,500+ to 6,300+. Improved GRASSLinks map interface so that map queries are much faster when national highway data are used (this layer has no query data so was stalling the system by about 20 seconds). Now these queries to bring up degree-days and calculators from a GRASSLinks map should take around 1 second. For example see the NW USA daily DD maps. An expanded "50-state USA" region choice is now available from the home page map calculator and models shortcut links (1st item in region drop down menus). Although DD maps are not yet available for Alaska or Hawaii, the online weather data and site DDs can now be accessed for these states using this method, plus there is an Alaska stations table, as before.
06/1/2005
Rebuilt Gubler-Thomas powdery moldew model for the Medford/Bear Creek weather network, as per request by wine grape growers.
05/18/2005
Repaired Oregon only degree-day maps. An error had crept in about the time when legends were improved (1 month ago). These are at:
ddmaps.html
and ddmaps_n.html. These maps
still have some problems - the Oregon base 32 map has a legend that makes the map harder to read. But others such as Medford, Hermiston and Ontario are now of the same accuracy but with higher resolution as compared to using a state or regional map and then zooming in.
Snotel data was switched from determining max min temperatures from the hourly (or less) reports, to using actual reported max mins from NOAA/Missoula. Prior to this time, the NOAA/Missoula actual max mins were in error but these were recently corrected. Therefore, in many cases prior to this date, our Snotel max's tend to be lower than actual, and min's tend to be higher than actual. Hopefully (as the weather is finally warming up) the existing past errors are small, cancel out to some degree, and occur only in non-agricultural areas. As with all weather networks, our site is a secondary data source, so please go to the primary sources or NCDC for climate data sets to use for purposes other than running pest models.
04/14/2005
Revised and renamed US Degree-day mapmaker (to usmapmaker.pl) program with much better ability to support handheld devices, updated documentation, some new features, and some changes to the GRASSLinks interface. Now the optional legend link will open a new window with a custom legend for the newly created map, regardless of legend type. Formerly, only static legends had been prepared for legend types other than heat ramp, which is the default. The default image type was changed from the newer (and not as well supported) PNG format back to GIF, whereas an option was added to allow selection of either PNG, JPG, or GIF. A new animated GIF of degree-day mapmaker will display during the 10+ second wait required for map construction. The program will now work fairly well in browsers as small as 320 pixels wide, and has even been tested successfully from a Palm Treo 600. This will allow access to degree-days in the field anywhere in the coterminous USA (with some constraints).
03/23/2005
Updated home page to reflect national focus of this website and to link in the new daily DD maps national index page; fixed a bug in some of the daily degree-day maps. We have yet to add historical average station files (other than Western US) to the system, so historical average DD maps will be less precise until this task is complete.
03/15/2005
Recently repaired Medford and COOP network data feeds. RAWS was down at the source feeds 3/12-3/14, should be OK now.
02/26/2005
Revised system for Medford data now back online and ready for testing. Close to 3600 stations total and national daily maps, degree-day calculations and models and DD mapmaking are now undergoing testing. For example, see North Central table or North Central daily maps.
10/11/2004
OSU Weed Scientist Jed Colquhoun's new small broomrape has been added. Data from NOAA were down for the last few days due to a data format and website change. The data are now being restored. Thanks for your patience.
09/22/2004
National Weather Service forecasts have been integrated into the homepage and ddmodel.pl program. You can enter your city, state or zip code for
the NOAA/NWS zone forecast, for weather forecast maps, quantitative precipitation forecast maps, and more, configured for the Northwest.
09/19/2004
The downy brome model has been updated with the help of Sandy Frost and Dan Ball, OSU Pendleton. It now represents (and links to) a new publication by Ball, Frost, and Gitelman, Weed Science 52:518-524. 2004.
08/9/2004
Due to personnel changes at Bear Creek Orchards, the public version of the Medford weather network may be down on occasion. The Medford Agrimet station remains representative of the region so you may want to use that one.
06/30/2004
Please take a moment to fill out our new user survey, it will aid us in evaluation of this website. Added a table of sites available in the SW USA, consisting of 241 METAR stations, in the states CA, NV, UT, AZ, CO, NM, W. ND, W. SD, and W. NE. A map access page to DD calculations for both current and historical sites is linked from this page.
06/29/2004
We have added around 500 historical (avg 1971-2000) weather stations to the system, from the states AZ, NM, AK, and S. Calif, for a total of 2084 historical sation records. SW US DD maps now utilize these data.
05/21/2004
We have added a brief (10-question) user survey, please take a moment to fill this out if you use this site and would like us to continue to improve it. We plan to leave this survey up for only a short while, and may have other surveys in the future, as a way to gather feedback and to profile users of this website.
05/19/2004
A new version of the main DD modeling/calculator tool, ddmodel.pl was deployed today. This new version, 3.50, provides a number of new features and fixes, including:
- National Weather Service 7-day forecasts for anywhere in the US (enter zipcode or city, state). Read here for details.
- In the output, above the NWS forecasts, the header line includes a link to the local zone forecast and current conditions formatted from National Weather Service reports, also anywhere in the US (not always available, depends on local NWS availability).
- The "simple header" feature now works. If you get tired of seeing/printing the logo and photos shown with certain models, click on "simple header" and they will not be displayed, both in the input form and in the output.
- The "bookmark/save model settings" feature has been improved. Now ALL settings (except a filename for file upload) are displayed in the web address, if you click the button under the model selection (or reselect the model, as it worked in the past), then you may bookmark (save Favorites) the settings, or make a hard link from a webpage. You could also use your browsers File, Send Link menu option (Netscape browsers) to email yourself or others the new link. This feature can save considerable time for those using the tool frequently.
- If you need to, you may now "clear all values" by clicking a button to the right of the "Calc" button.
- The instructions page has been expanded and provides more detail on using the calculator.
03/14/2004
We moved to a new server during the first week of March, which produced several issues, most of which have been solved. The new server is ca. 2.4 times faster than the last, and will be much more scalable in the future. It is a dual Xeon 3.2 Ghz 2U rack server from HP. We are still trying to restore Medford grower data, and to initiate data from The Dalles and the Willamette Valley.
02/02/2004
The NW degree-day mapping calculator now serves the 11 state W. region USA, and the DD Models Map shortcut also reaches the entire west.
01/27/2004
Degree-day maps are now available for the 11 state W. region USA, using the new W. US NWS/Metar stations. Average data is still needed for S. CA, AZ, and NM for calculating the NORMAL and DEVIATIONS from NORMAL maps.
01/17/2004
Ca. 335 Snotel stations (NRCS) for the 5 state NW have been added and are accessible from the state data tables and from the GIS/map interface to DD calculators. Also, ca. 240 W. US NWS/Metar (airport) stations have been added and most of these are accessible from the maps on the home page. Total station count is around 1400+ at this time. Plans to add grower stations from The Dalles and Willamette Valley (OR) networks are underway ... - Len