Introduction
This risk model app uses weather data to calculate how readily spores of the causal agent carrying the box or boxwood blight disease can start new infections. The disease, caused by the fungus Calonectria pseudonaviculata, can result in defoliation and decline of susceptible varieties. These include most varieties of Buxus sempervirens such as "Suffruticosa" or English boxwood and "Justin Brouwers". Many varieties of B. microphylla and B. sinica are less susceptible but can be carriers without symptoms.
This app is a newer, streamlined interface for the existing model, which is also available through MyPest Page.
Usage
To use this app, select the "Inputs" tab and find a weather station code that you can pick from a list or optional Google Map after entering a place name or zip code. With a weather station code selected, run the model by selecting either the "Graph" or "Table" tabs. You can also change the start date and span of days (both optional - default is from 2 days ago to 5 days into the future if a forecast is available). If only 2 days are shown in the table output and the risk is zero - then you probably need a different weather station!
Also, try running using several stations to see whether they agree, as some stations have poor weather data or perhaps a recent outage. Use at your own risk. You can also try our Synoptic Risk Map for Boxwood Blight to see current risk conditions in all of the continental US.
Infection Risk
Generally it should be very humid or raining and at moderately warm temperatures (60-85F) for a couple days for infection risk to be high. Also you must have an inoculum source present nearby for infection to occur. The model output gives you a choice of a graph and a table, both with color-coded risk levels and descriptive labels for risk. It has not yet been determined what level of risk to use as a threshold for management such as the use of fungicides. For more information on managing box blight, see this PDF publication from Virginia Cooperative Extension.
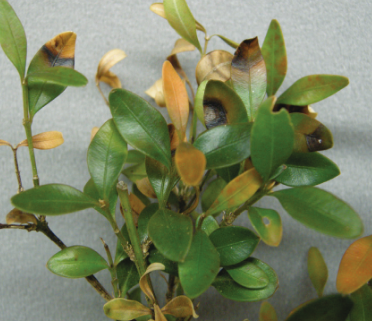
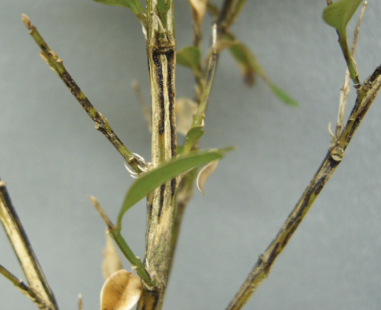
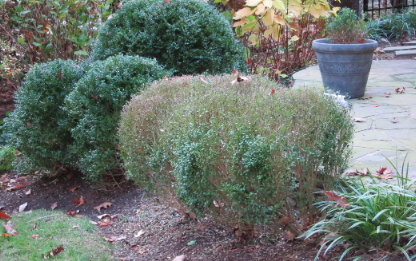
Symptoms
Include brown leaf spots (Fig. 1) and black streaking on stem tissue (Fig 2) that lead to defoliation (Fig. 3). As mentioned earlier, tolerant, less susceptible varieties may harbor the pathogen yet show no symptoms. Photos from the U. VA link above:
Technical information about boxwood blight and this model is available on our disease risk model documentation page.
Disclaimer: The index is intended to inform your decisions about management actions, such as choice and timing of control measures and intensity of scouting. It should supplement, not replace, the other factors you consider in making these decisions. Use at your own risk.
Email Subscription
Automated email delivery of the disease risk index outputs displayed in this app is available at no cost. An email subscription offers model results for this and several other plant disease models, for up to three weather stations, on a schedule that you select. To subscribe, you will need a uspest.org account.
Acknowledgements
- This app was funded in part by the US Farm Bill FY17 and sponsored by the USDA APHIS PPQ project, "Enhancing boxwood blight mitigation through innovation, integration, and education", with collaborators from VT, Cornell, NCSU, OSU, and USDA ARS
- This work was funded by grants from the USDA NIFA Western Region IPM Center, and the Oregon Agricultural Experiment Station.
- This app was funded in part by the USDA National Institute of Food and Agriculture, Crop Protection, and Pest Management, Extension Implementation Program (USDA-NIFA-CPPM-EIP).
- Dan Upper provided programming for the project.
- Location search uses data © OpenStreetMap contributors and data from MaxMind.