| MyPest Page - IPM Pest and Plant Disease Models and Forecasting |
|
for Agricultural, Pest Management, and Plant Biosecurity Decision Support in the US |
|
Introduction: This website brings together US weather data and plant pest and disease models to serve many decision support needs in agriculture. Currently this site provides over 73 degree-day and 18 hourly weather-driven models serving many IPM, regulatory, and plant biosecurity uses for the full USA, and specializes in IPM needs for the Pacific Northwest. Weather data and forecasts are currently linked to the models for over 15,000+ US and nearby weather locations. Forecast sources include NWS Digital forecasts in all states, Fox Weather LLC forecasts in OR, WA, ID, W. MT, and CA, and NWS Zone forecasts for all US regions (max-min forecasts). Funding has been provided by numerous USDA NIFA grants, USDA RMA ipmPIPE grants, NPDN grants, WR-IPM Center and Oregon Statewide IPM funds, and local and regional commodity grants. Online Survey: Please fill out our brief end-user survey! This site is free - please provide us feedback! Additional Resources: Try the main homepage - use with most web browsers What's new Online tutorials Degree-day usage instructions Technical documents - how to customize settings for: webpage bookmarks and pest model charts and tables for mashups -  4/22/2011 4/22/2011 Frequently asked questions Related web sites Full station list Presentations: 09/06 Grower network support - slideshow 06/08 IPM Tools in Real Time
Quick Start:
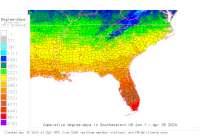
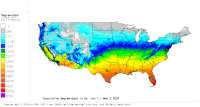
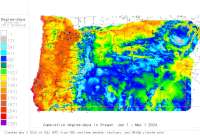
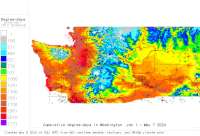
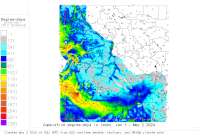
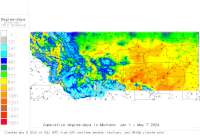
Map Index: to plant disease risk and degree-day models 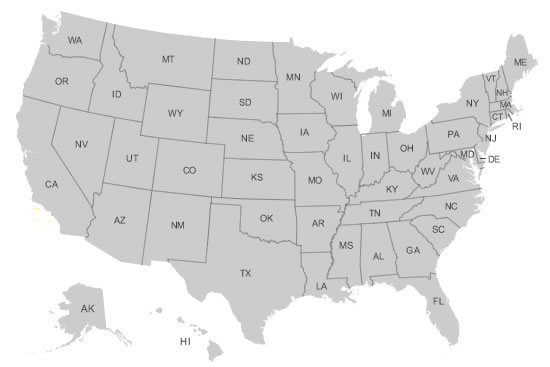
Shortcuts: Index of online tutorials Table index of US states and networks linked to models Selected agricultural weather network tables and home pages: Oregon: Hood River, The Dalles, Medford, Milton- Freewater, NW Rubus, AgriMet, Pudding & Yamhill Basin IPM Washington: AgWeatherNet, AgriMet Idaho: AgriMet Montana: AgriMet, MSUSPUD California: CIMIS, PESTCAST Table of all 73 degree-day models Plant disease model shortcuts: Grass seed stem rust, Swiss needle cast Disease alert maps: Tomcast DSV: current, 2010 index Soybean rust: current, 2010 index Fireblight: current US, current w/2-day forecast - PNW, past/movie Tomato-potato late blight: current, movies: NEast 2010, NEast 2009, NY 2010, NY 2009 PNW interface to online phenology models and degree-day calculator
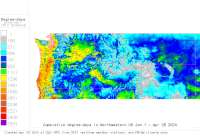
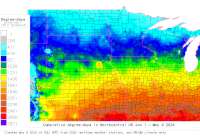
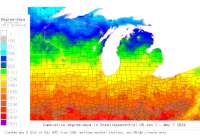
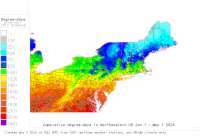
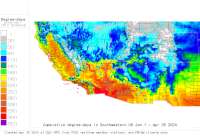
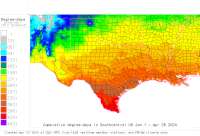
Degree-day Maps: Custom degree-day mapmaker for 48 US states - use your own settings: new server (fastest), 2nd server, old server (slowest)
| ||||||||||||||||||||||||||||||||||||||||||||||||||||||||


|
All data are provided "as is" and users assume all risk in their use - see full disclaimer. See also OSU Disclaimer. All NWS derived data is not subject to copyright protection. This site hosted by the Integrated Plant Protection Center at Oregon State University with support from the USDA National Plant Diagnostic Network, The OSU Agricultural Experiment Station, various USDA CSREES/NIFA grants, USDA RMA, and USDA IPM Centers - Western Region. Climate map data provided by OSU PRISM Group, real-time public weather data provided by U. Utah Mesowest and other networks including WSU AgWeatherNET, AGRIMET, CPS Adcon Networks, IFPNet Automata, California CIMIS, California PestCast, and others.
This page on-line since April 5, 1996; last update Sep. 28, 2011. Contact Len Coop, OSU IPPC and Botany & Plant Pathology Dept. at coopl@science.oregonstate.edu or 541-737-5523 if you have any questions about this information.